Real Estate Data HQ
Clear analytics for property managers, brokerages, and investors.
Provided through a monthly subscription model with daily, weekly, or monthly data refreshes and tiered dashboard access.
Property Manager Dashboards
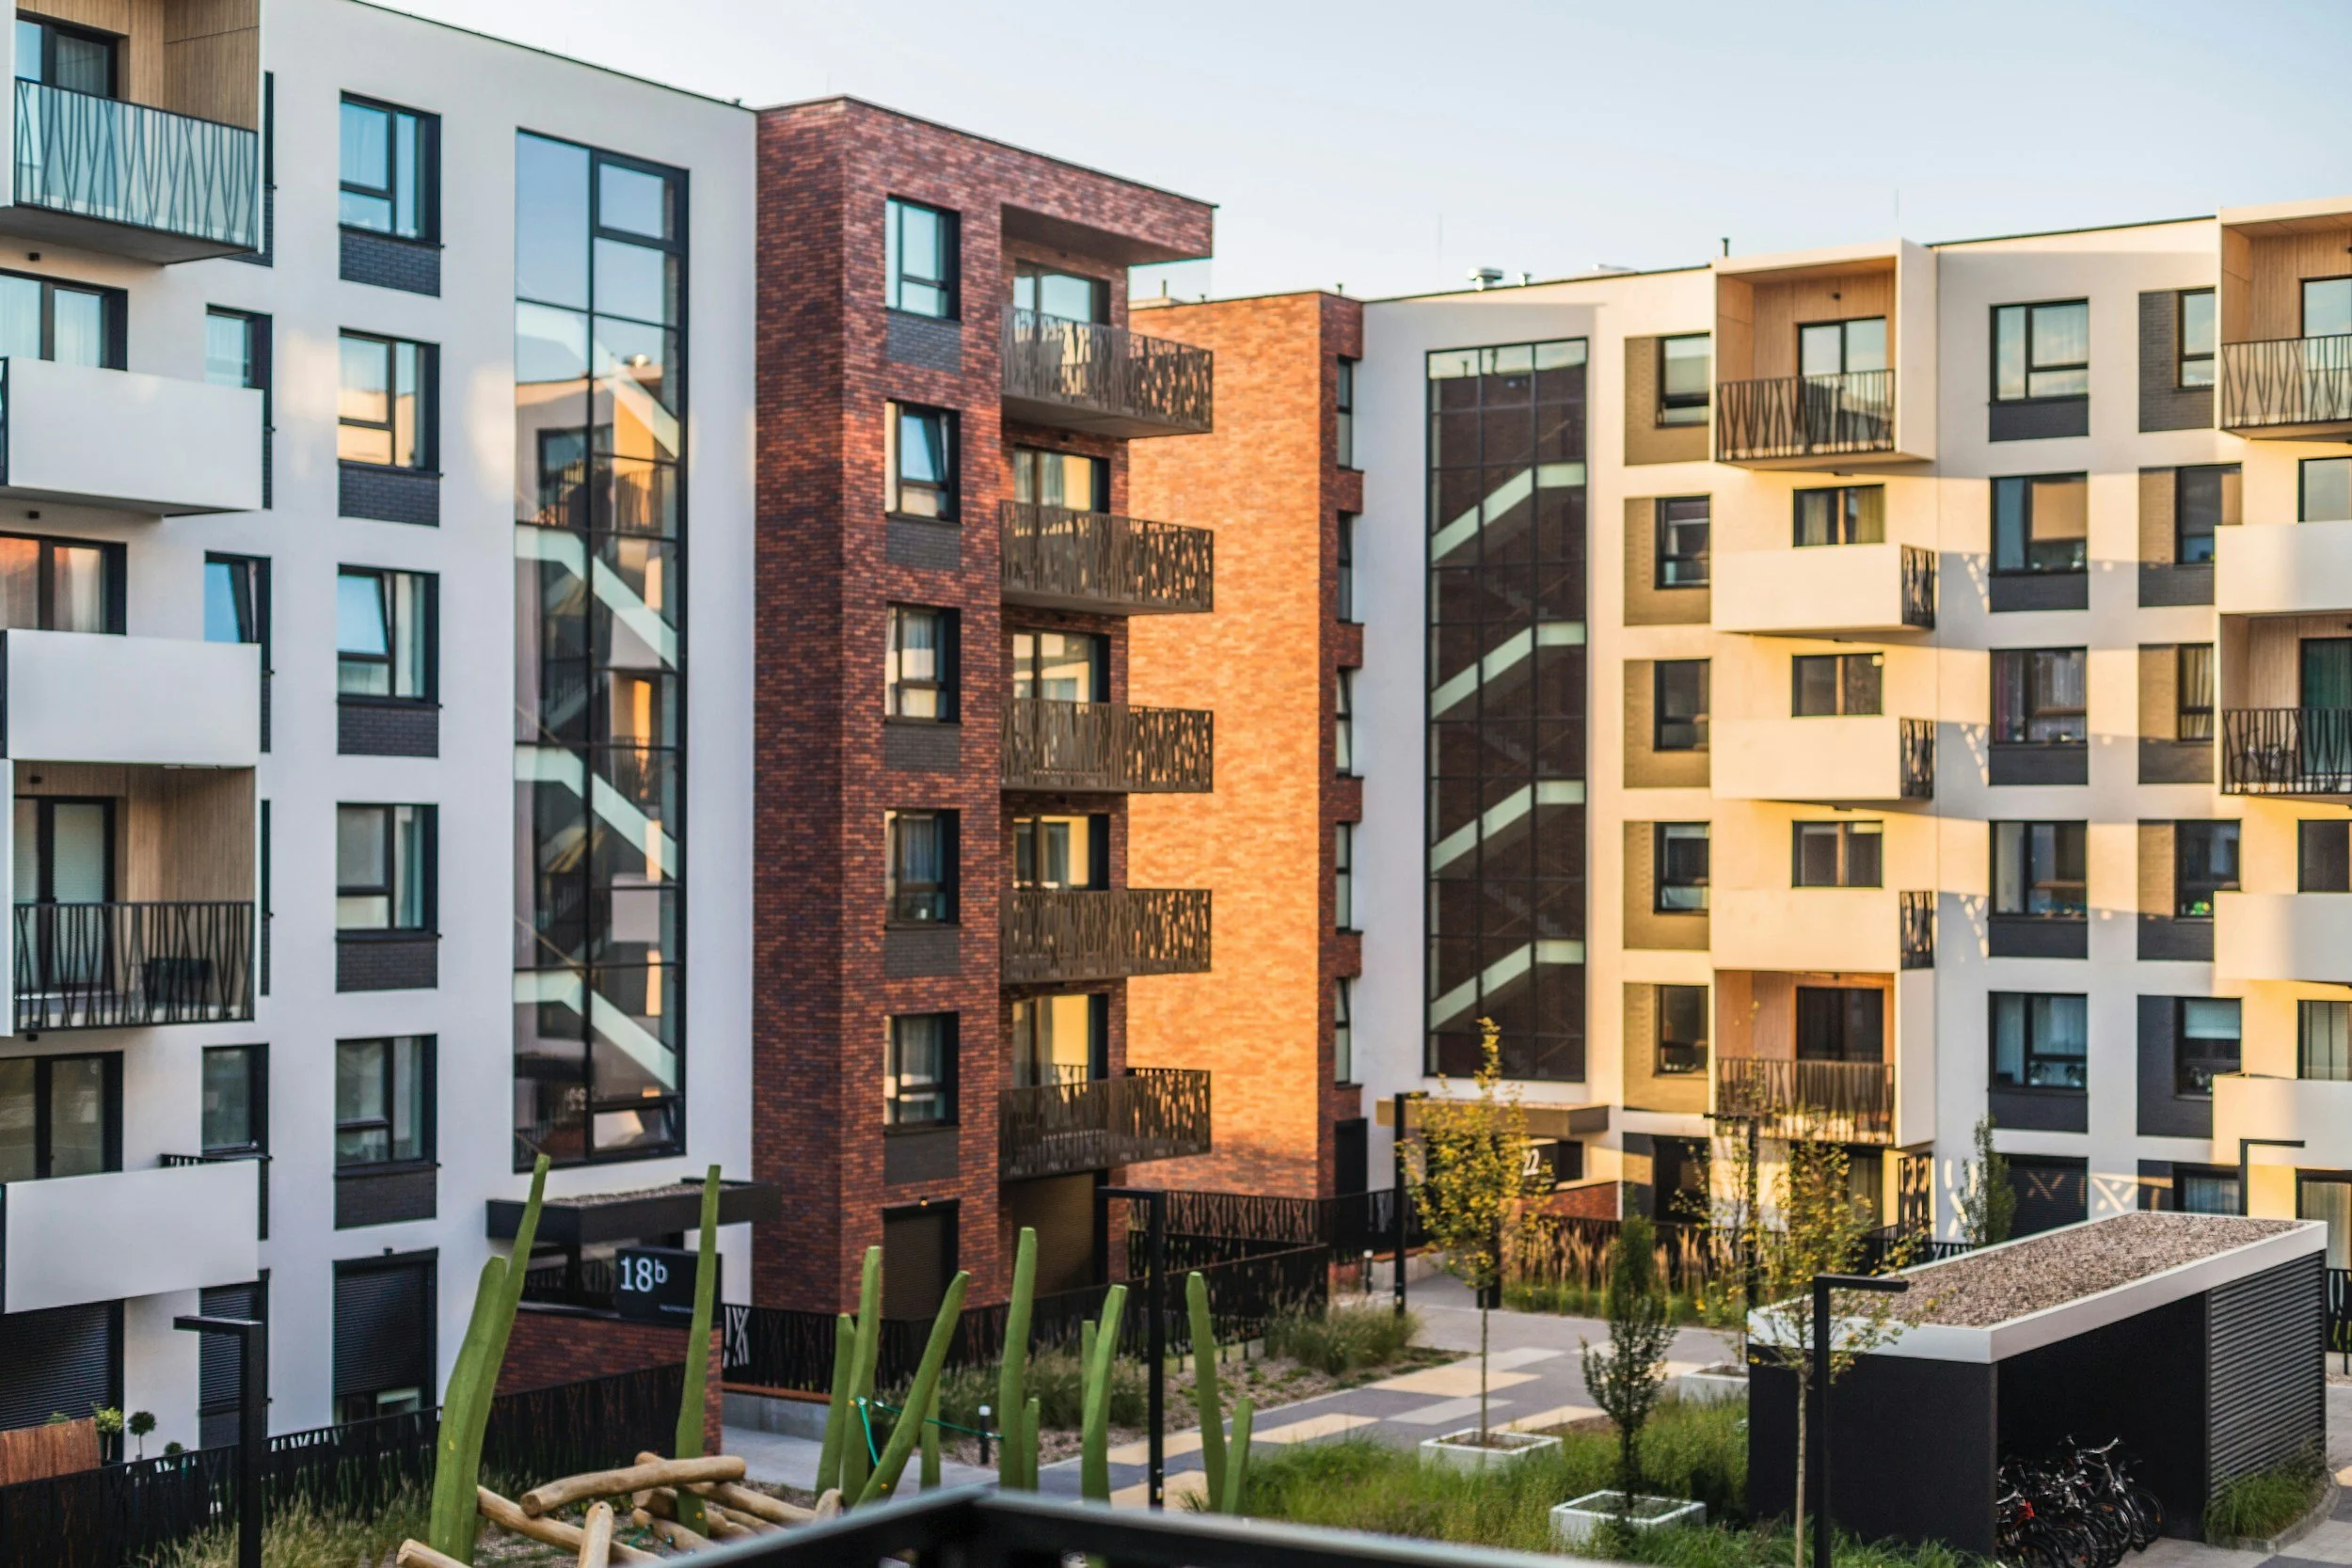
Monitor day-to-day operations with dashboards built around the KPIs that matter most. Flexible dashboard filters allow performance to be analyzed as a company, by department, or by individual team member.
Popular KPIs & Charts
Occupancy Rate
Delinquency Rate
Collection Rate
Leasing Conversion
Average Application Processing Time
Work Order Completion Trends
Unit Turn Duration
Maintenance Completion Trends
Move-In / Move-Out Trends
Resident Satisfaction Scores
Real Estate Sales Dashboards
Gain visibility into sales activity. View performance across the entire company, specific teams, or individual agents with flexible filtering.
Popular KPIs & Charts
Average Days on Market
Average Commission Generated
Revenue
Closed Transactions
Total Sales Volume
Average Sale Price
Listings Taken
Buyer vs Seller Transactions
Pending Deals
Investor & Portfolio Dashboards

Track how each asset is performing across acquisition, investment, and ongoing revenue.
Popular KPIs & Charts
Rent Roll Visualization
Average/Total Purchase Price
Average/Total Sale Price
Capital Invested by Property
Net Cash Flow
Portfolio Trends
Geographic Distribution Visualization
Revenue
Expense Trends